
Buildings Energy Consumption
The calculation of the energy consumption is based on the “Building certificates of energy characteristics” dataset from more than 2,500 representative buildings in Sofia, provided by the Agency for Sustainable Energy Development. The energy dataset includes the total building area and energy consumption per unit area (energy flux).
For each of the categories, a distribution-free (p, α) tolerance interval, defined as TI=[▁TI,¯TI], is computed, which contains a proportion p of the population with 100(1-α)% confidence. The bounds of the tolerance interval can be propagated through further analysis and visualisation. Computing a tolerance interval was chosen, rather than a central tendency statistic, for two main reasons.
Firstly, anybody that is likely to use the analysis will be interested in problematic areas and building types, as indicated by the upper bound of the interval, ¯TI, rather than the average consumption of buildings. This is to say, energy consumption stakeholders will likely not be indifferent to whether individual buildings exceed mandated reference values or not. At the same time the lower bound of the tolerance interval, ▁TI provides a “best-case” consumption indicative of the state of the art in achievable building efficiency. Central statistics tend to mask such behaviour by only caring about some average measure of consumption for the whole class. The use of a high proportion, p, widens the apparent consumption ranges but provides a statistical guarantee that the unobserved part of the respective building class will not significantly exceed the calculated figures. The second reason behind preferring the distribution-free (p, α) TI to a central statistic is that the nature of the data precludes the usefulness of central tendency statistics due to either complex distributional shapes or small sample sizes. The TI and tolerance statistics in general can automatically alert the analyst about the achievable confidence, given the size of the data set. Furthermore, assuming a distributional shape for the data will produce tighter results, but will often be unjustified, especially at small sample sizes.
It must be noted here that tolerance intervals provide statistical rather than mathematical confidence and as such if propagated through all but the simplest subsequent analyses their values may no longer possess the same level of confidence or population bounding, even with the use of purpose-made intrusive or non-intrusive techniques. Instead, advanced uncertain numbers, such as confidence boxes, translated to the tolerance domain need to be used to obtain these guarantees.
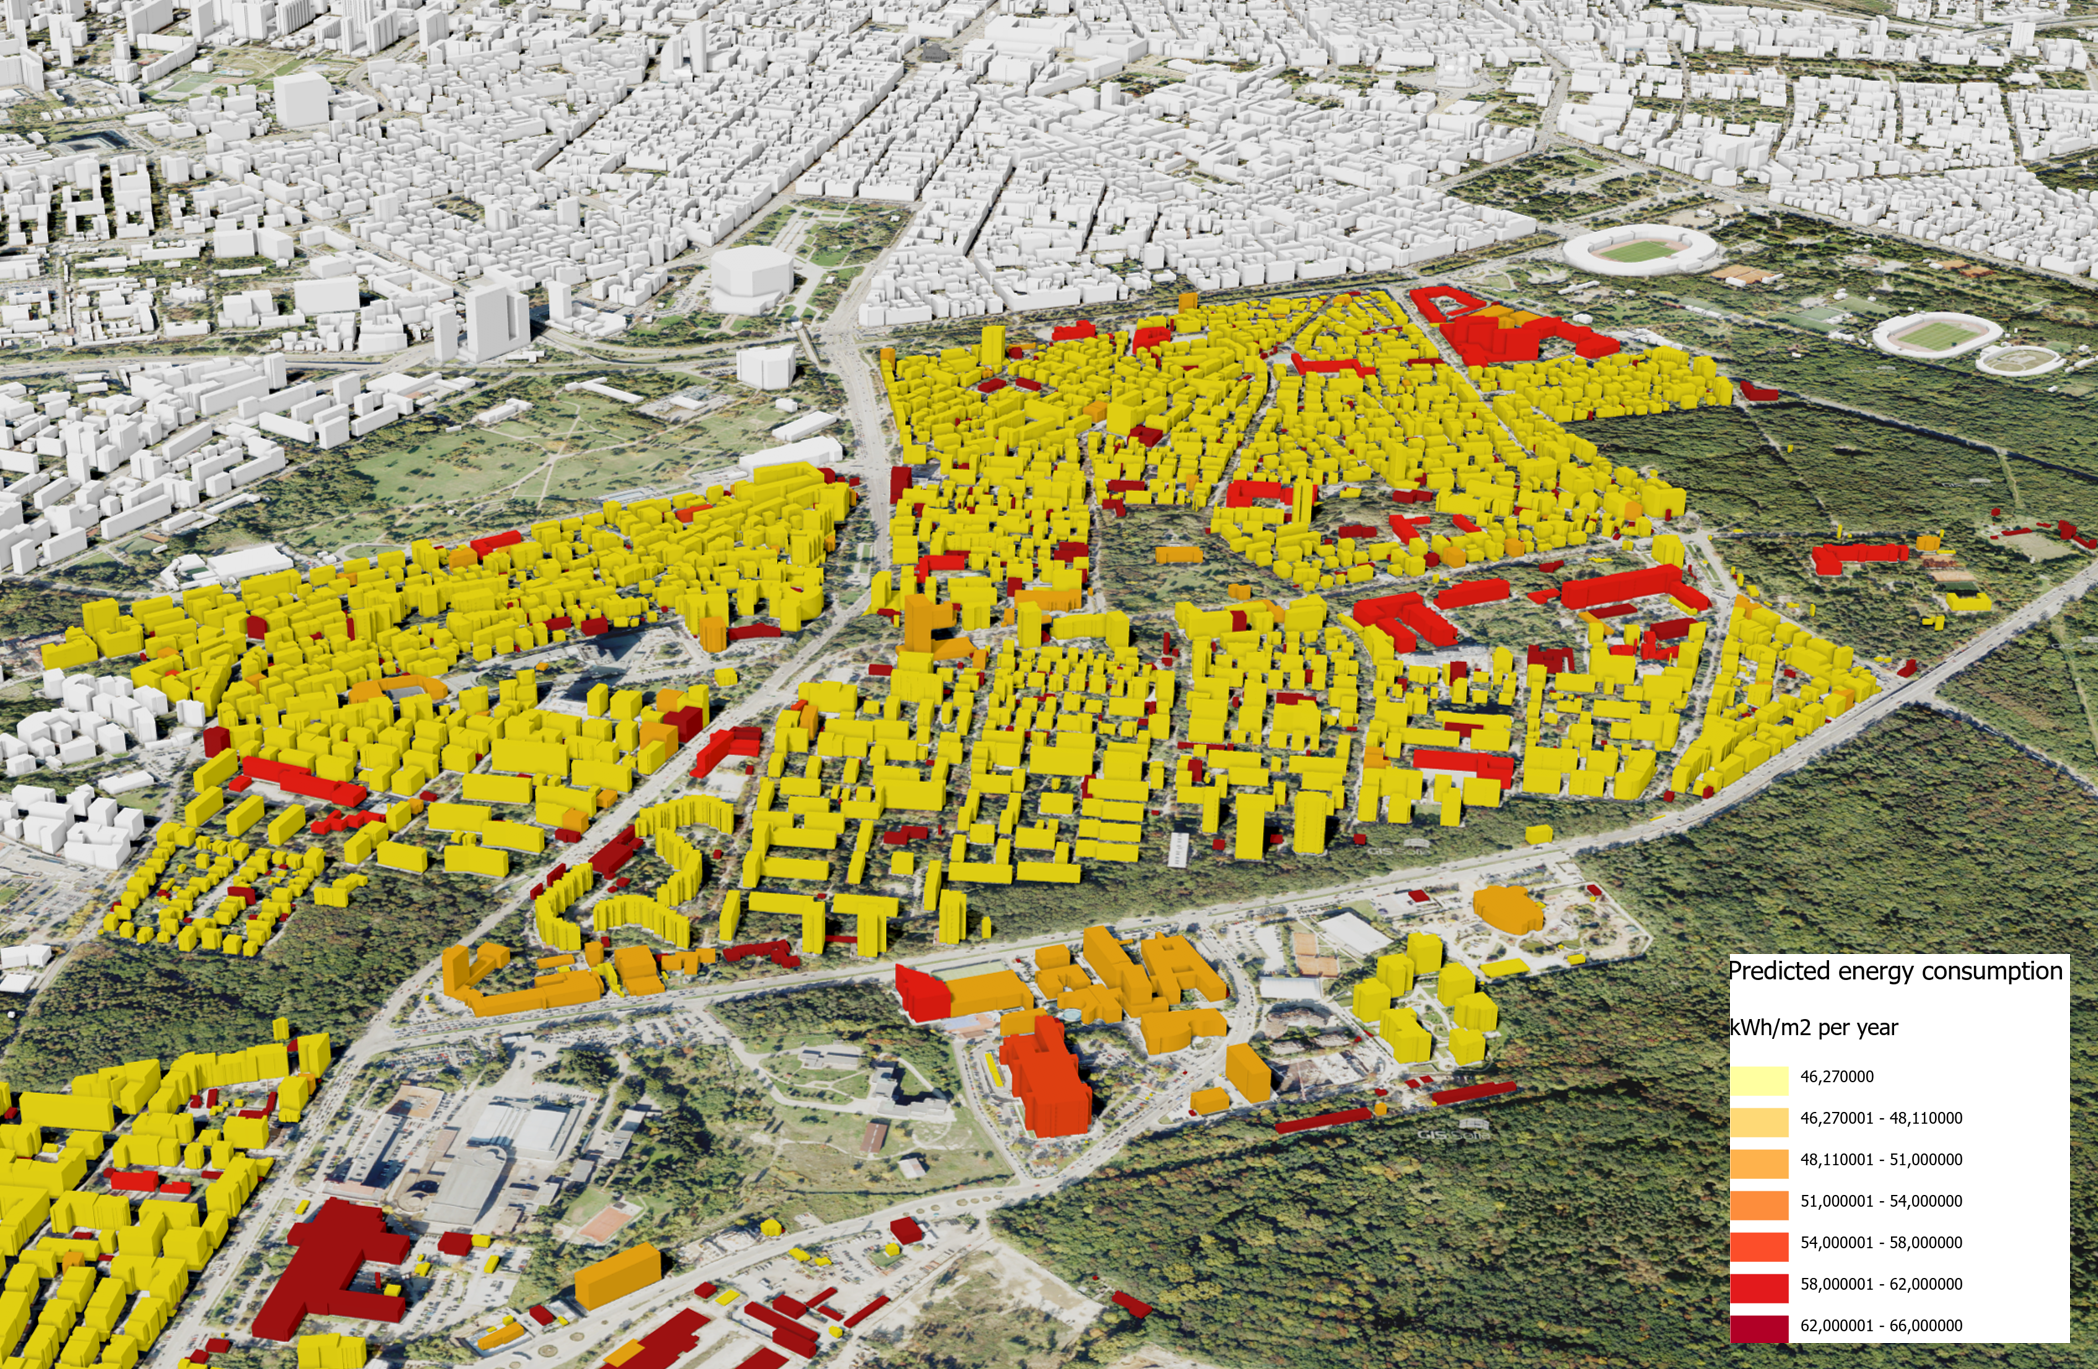
The final step of the work is to present the results in a convenient tool to be used by different stakeholders. The energy consumption scenarios are used to enrich a 3D model of the city, which can, in turn, be visualised and queried in a web browser to provide insights for citizens and support decision-making for city authorities.