
Indoor Temperature Monitoring and 3D Spatial Analysis
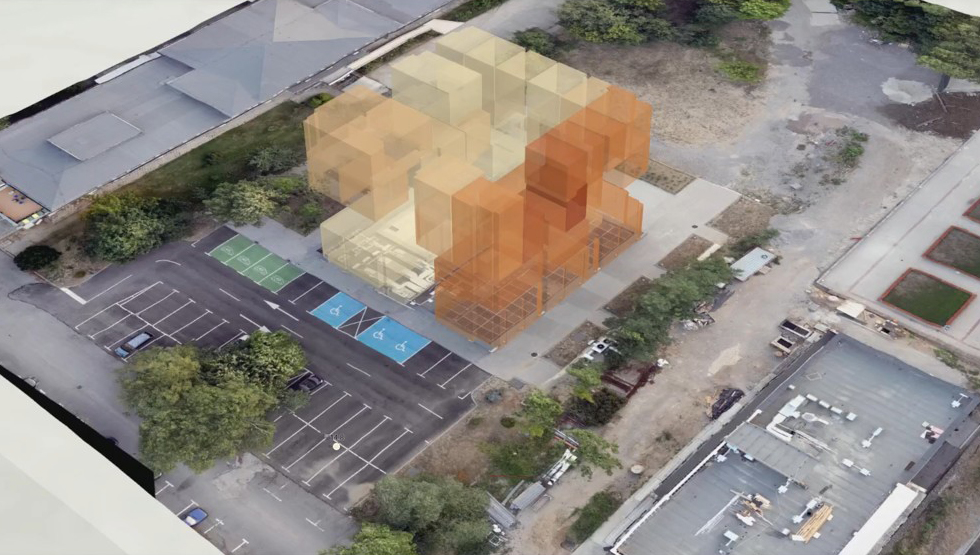
The study showcases the integration of real-time environmental sensor data into a 3D digital twin of the GATE Institute’s building using ArcGIS Scene Viewer. 41 IoT sensors, installed across various rooms and floors, record temperature, humidity, and CO₂ levels every five minutes. The current focus is on temperature, a key factor for comfort and energy efficiency. Through temporal and spatial visualization, we examine daily patterns, floor-level trends, hotspots, and anomalies. The data reveals insights such as deviations from the optimal comfort range of 21–24°C, helping identify areas for better climate control and potential energy savings. These findings are spatially contextualized in a 3D model, transforming numerical trends into actionable insights for facility management and digital twin development. This analysis supports smarter operations, enhances occupant comfort, and demonstrates how data-driven strategies can optimize urban building performance.