
Pedestrian wind comfort
Wind flow in an urban environment is heavily influenced by the layout, shape, size and configuration of buildings. At times, the presence of buildings can lead to increased wind speeds which could be dangerous for pedestrians. This has raised the necessity to conduct a wind comfort assessment in the early planning stages of the urban environment.
The main aim is to help policymakers towards making informed decisions to ensure a safe urban environment where the wind does not pose any threat to pedestrians. This effort also aims at advancing the knowledge frontier of urban wind simulation techniques.
The main approaches for the assessment of wind behaviour in the past have included full-scale testing and wind tunnel testing. The rapid development of computational resources in the past decades has enabled the use of Computational Fluid Dynamics (CFD) as a tool to carry out pedestrian wind comfort studies. It provides a faster and less expensive alternative which can often also provide more information about the wind flow compared to the more conservative methods. Therefore, CFD has been selected as the method of choice to achieve the objectives of this task.
Urban wind flows strongly influence pedestrian comfort and safety. CFD makes it possible to model how building arrangements and street networks shape urban airflow and microclimate. Computational pedestrian wind comfort studies are carried out in various urban areas in Sofia city as well as a part of the evaluation of different urban designs produced within parametric urban planning use cases. The results offer detailed information about the wind behaviour and are used for developing the City Digital Twin pilot project at GATE.
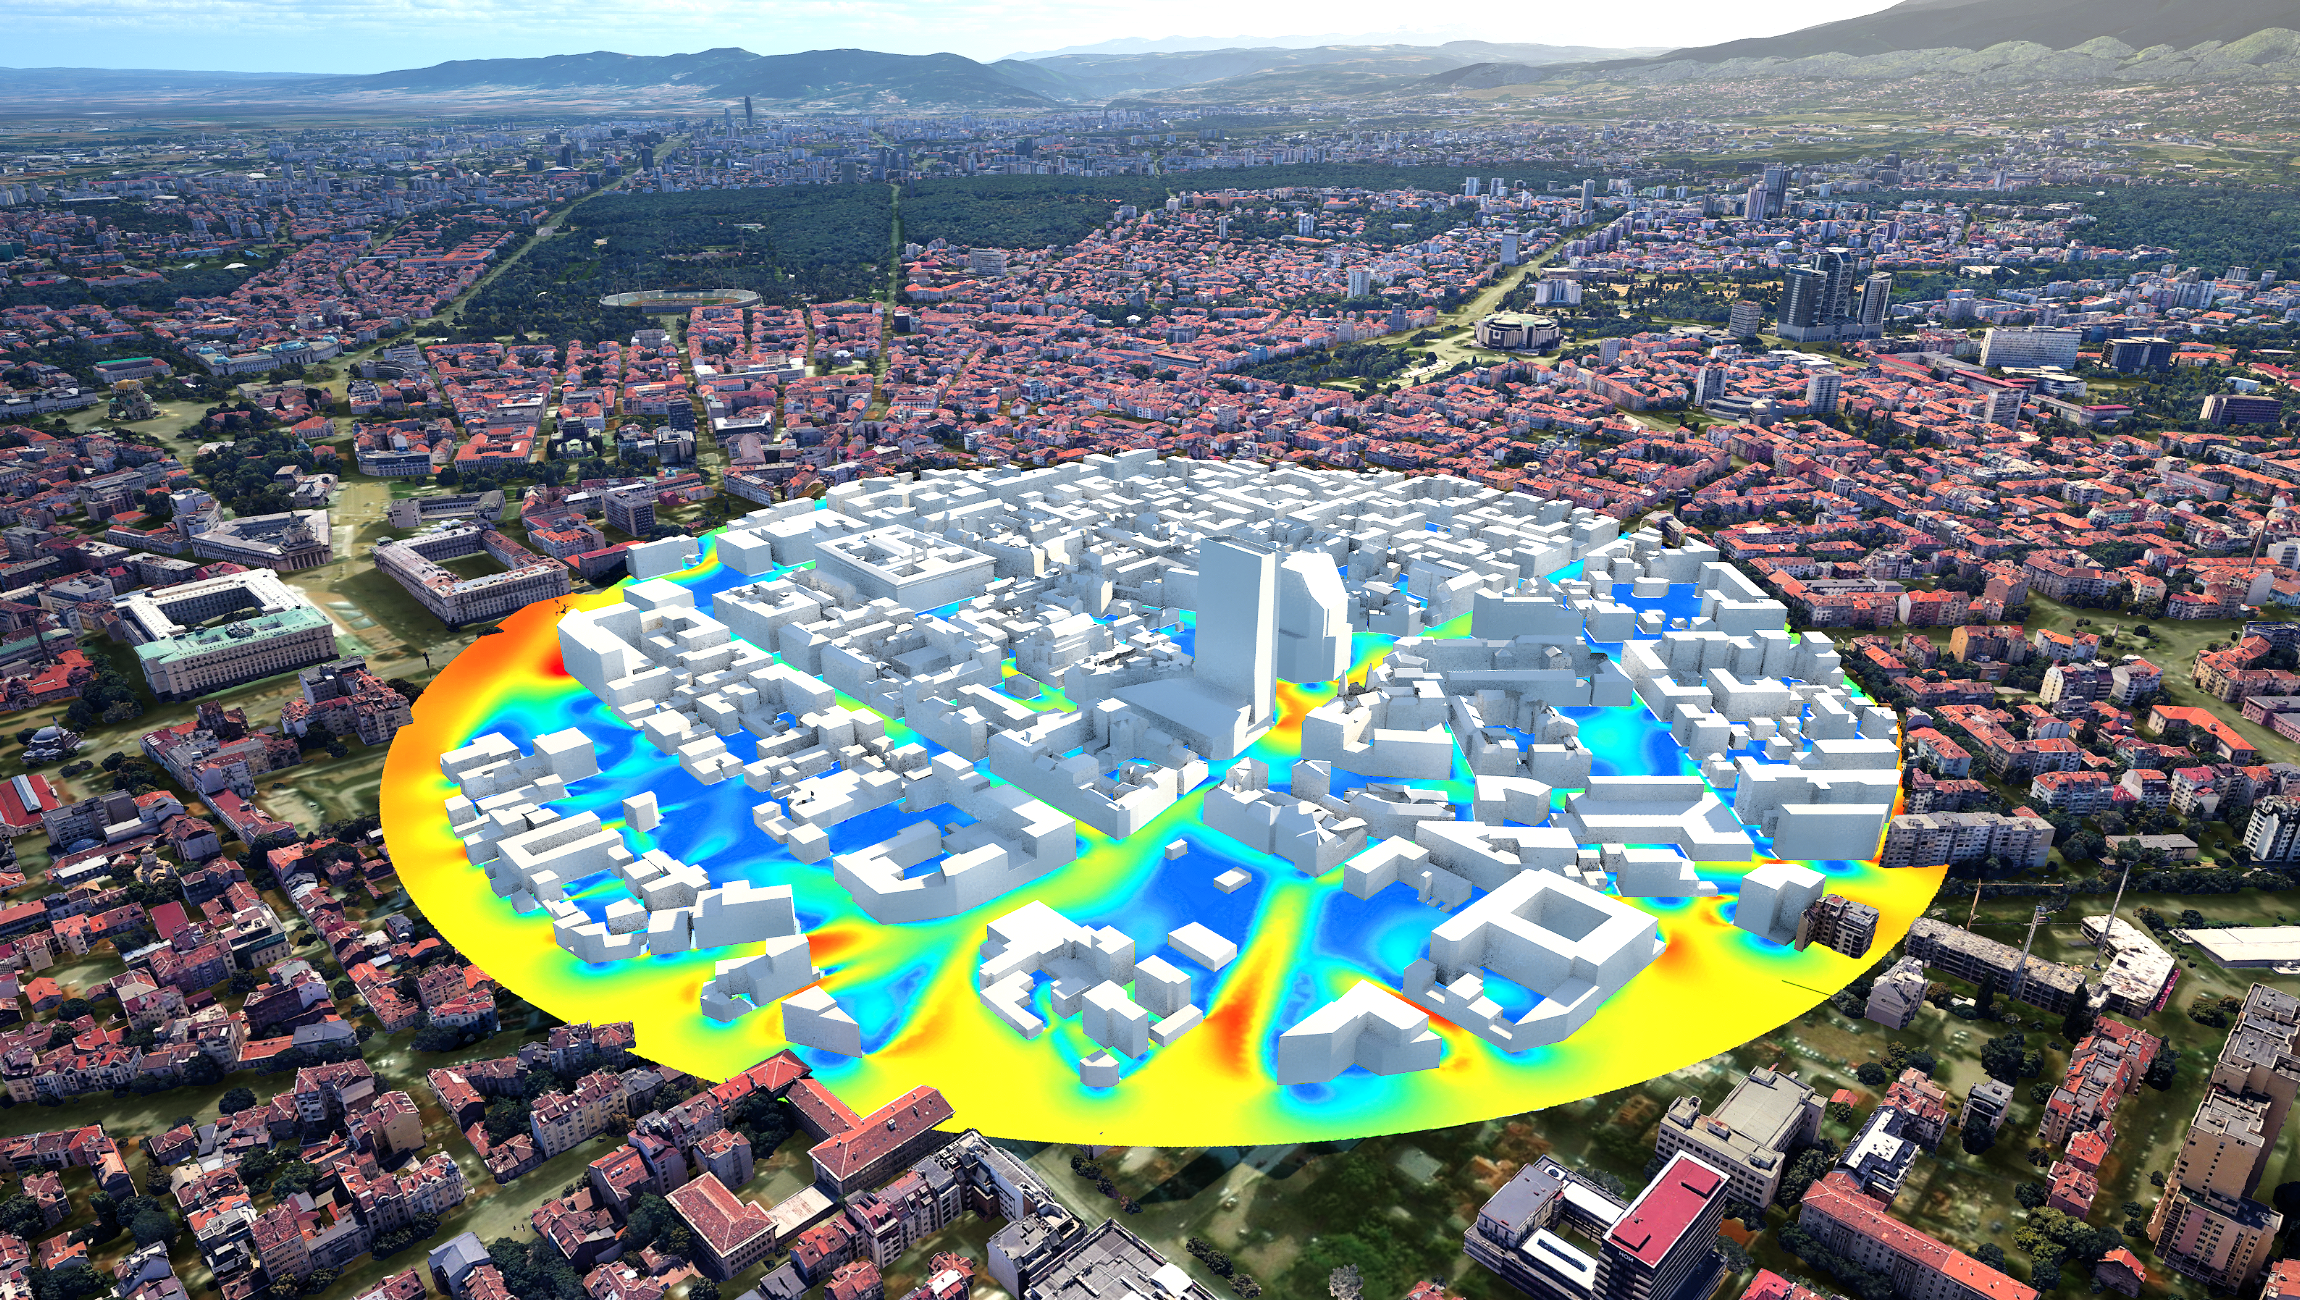
The wind velocity distribution at pedestrian level is simulated in a region of Sofia's city center for wind coming from the north-northwest direction . The analysis is carried out in Аnsys® multiphysics software, and for better immersion in the urban environment, the results are visualized also in Unreal Engine®. The areas marked in blue indicate lower speeds or stagnant air, while areas marked in red show higher flow speeds and better ventilation. Such analyses can support urban planning decisions—such as identifying suitable locations for greenery and recreational areas or adjusting building and street layouts to enhance pedestrian comfort and safety.
The map bellow shows top view of wind velocity distribution at pedestrian height: (A) Macedonia Square and (B) Court of Justice
The GATE Institute team expresses its gratitude to Orfeas Eleftheriou and to the Digital Twin Cities Centre (DTCC) for the development of the Unreal Engine visualizations, which bring complex urban simulations to life and make them accessible to a wider audience. We also express special gratitude to our partners at DTCC, Chalmers University of Technology and the National Research Infrastructure for Data Visualization (InfraVis), Sweden, for the successful collaboration and shared commitment to the development of research and innovation in the digital urban environment.